
Accident/Incident Ratio Studies
There is no shortage of data on incidents such as accidents or near misses. Some researchers have studied the figures in detail and concluded that
there appears to be a relationship between the numbers of different types of accidents.
F. E. Bird used accident data to produce the following accident triangle:
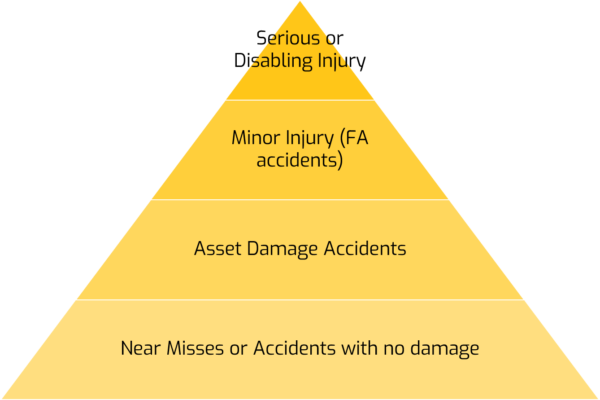
Other researchers have produced similar accident ratio triangles:
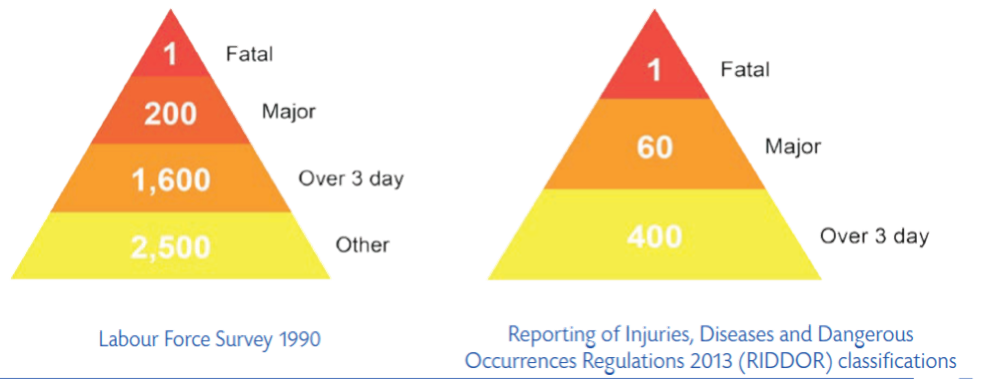
The actual figures vary between the different accident triangles but the important thing to note is that, for every major incident or fatality, there are many more less-serious or near-miss incidents.
The analysis also shows that:
It is invariably a matter of chance whether given event results in injury, damage, or a near miss, i.e. near-misses could so easily become more serious incidents.
Near-miss/less serious incident data can, therefore, be a useful predictor of accident potential.
All events are due to failure to control – so we can learn from even minor incidents.
The data from these triangles has a number of limitations that you need to think about before trying to apply it:
Not every near miss or minor incident involves risks that could actually have led to a serious incident or fatality.
Be careful comparing:
Different triangles.
Different definitions (e.g. lost-time accidents).
Different industries (with different types of risk).
Statistical significance – you need a certain amount of representative data for a meaningful comparison between your workplace and industry as a whole.
Accident
Comments
Sign in to join the conversation