
IA5 – Summary
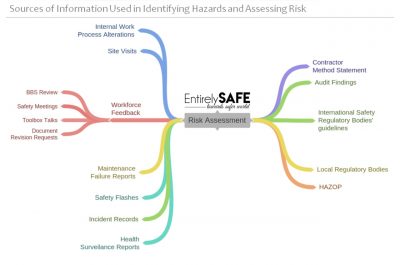
1. Sources of Information Used in Identifying Hazards and Assessing Risk
Accident/Incident and Ill-Health Data and Rates
incidence rate,
frequency rate,
severity rate and
prevalence rate.
Internal & External Information Sources
Uses and Limitations of Information Sources
Internal
Incidence are rear events
External
Different industries
different multiplier
different terms of reference (definitions)
Overtime or part-time workers are not taken into account
The figures may be for workers only
Culture differences
Different risk levels
different risk management arrangements
2. Hazard Identification Techniques
Hazard Detection Techniques
task analysis,
checklists – covers the key issues to be monitored is developed to ensure a consistent and comprehensive approach to checking all the safety elements to be covered during an inspection.
observations and
incident reports.
Importance of Worker Input
3. Assessment and Evaluation of Risk
Key Steps in a Risk Assessment
Hazard identification.
Identify who is at risk.
Estimation, evaluation of risk and identifying precautions.
Record significant findings and implement.
Review the assessment.
Use and Limitation of Generic, Specific and Dynamic Risk Assessments
Limitations of Risk Assessment Processes
Temporary and Non-Routine Situations
Consideration of Long-Term Hazards to Health
Types of Risk Assessment
Generic – apply to commonly identified hazards and set out the associated control measures and precautions.
Specific – apply to a particular work activity and the persons associated with it.
Dynamic – apply to work activities that involve changing environments and require quick mental assessments to manage risks.
Qualitative – risks are represented by simple word descriptors.
– Risk = Probability (or Frequency) × Consequence (or Harm or Severity).
– Probability is the chance that a given event will take place.
– Severity of risk is the outcome.
Semi-quantitative – results represented by qualitative and quantitative descriptions. In some the risk is expressed as a number which indicates rank and not an absolute value.
Quantitative – risks are represented by the frequency or probability of a specified level of harm, from a specified activity.
Organizational Arrangements for an Effective Risk Assessment Programme
Plan – what you want to achieve, who will be responsible for what, how you will achieve your aims, and how you will measure your success.
Do – identify your risk profile, organise your activities to deliver your plan.
Check – measure your performance, assess how well the risks are being controlled and investigate the causes of accidents, incidents or near misses.
Act – review your performance and take action on lessons learned, including from audit and inspection reports. Once hazards have been identified, the risk they pose needs to be assessed and prioritised.
Acceptability/Tolerability of Risk
4. Systems Failures and System Reliability
Meaning of the Term ‘System’
complicated interactions between processes and that failure of the system may need detailed investigation to discover the causes by adopting both holistic and reductionist approaches.
Principles of System Failure Analysis
Using Calculations in the Assessment of System Reliability
parallel,
Formula: RS= 1 – [(1 – RA)(1 – RB)]
series,
Formula: RS = RA × RB
mixed systems
Formula: Calculate all Parellel Systems, then treat system as a chain of Series Systems.
Methods for Improving System Reliability, by using
reliable components,
quality assurance,
parallel redundancy,
standby systems,
minimizing failures to danger,
planned preventive maintenance and
minimizing human error
The ‘right’ person is doing the ‘right’ job.
The individual has adequate training and instruction.
The individual receives appropriate rest breaks.
The man-machine interface is ergonomically suitable.
The working environment is comfortable, e.g. noise, lighting, heating, etc.
5. Failure Tracing Methodologies
A Guide to Basic Probability
Probability is the chance something will happen.
Frequency takes account of the exposure.
To calculate the probability of two or more independent events occurring, we Multiply the probabilities.
To calculate probability of one event OR another, we Add the probabilities of the two separate events.
To calculate the probability of a probable event happening at certain frequency to cause harm we Multiply Probability by Frequency.
Principles and Techniques of Failure Tracing Methods in the Assessment of Risk
HAZOP
Keywords:
NO or NOT – Negation of intention, e.g. no flow.
MORE – Quantitative increase, e.g. high pressure.
LESS – Quantitative decrease, e.g. low temperature.
AS WELL AS – Qualitative increase, e.g. impurity present.
PART OF – Qualitative decrease, e.g. only one of two components present.
REVERSE – Logical opposite of intention, e.g. backflow.
OTHER THAN – Complete substitution, e.g. flow of wrong material.
Fault Tree Analysis
Keywords:
Event. To Understand: Divide 1 to contributing factors’ probability calculation result.
AND Gate – all events need to be present at the same time to allow the Top Event. – Most Efficient. To Calculate: Multiply Probabilities
OR Gate – one of the events need to be present at the same time to allow the Top Event. To Calculate: Add Probabilities.
Basic Fault
Event Tree Analysis
Appendix 1. Support Links
+ NEBOSH IDP - IA5+ NEBOSH - IDP
Comments
Sign in to join the conversation