Bow Tie Methodology for Assessing Risks & Identifying Controls

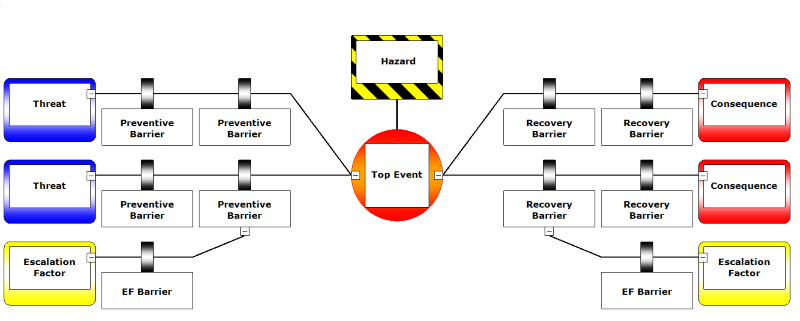
A ‘bowtie’ is a diagram that visualizes the risk you are dealing with in just one, easy to understand a picture. The diagram is shaped like a bow-tie, creating a clear differentiation between proactive and reactive risk management. The power of a Bow Tie diagram is that it gives you an overview of multiple plausible scenarios, in a single picture. In short, it provides a simple, visual explanation of a risk that would be much more difficult to explain otherwise.
1. Identify Hazards in Bow Tie Diagram
The start of any bowtie is the ‘hazard’. A hazard is something in, around or part of the organization which has the potential to cause damage:
- working with hazardous substances;
- driving a car;
- storing sensitive data
The idea of a hazard is to find the things that are part of your organization and could have a negative impact if control over it is lost. The rest of the bowtie is devoted to on how an organization will prevent that normal but hazardous operation from ending into something unwanted.
The first step is always the hardest and this is also the case here. Normally, starting with for instance a HAZID is a good way to get a long list of all possible hazards.
Bowties are then done only for those hazards with a high potential to cause extensive harm. Normally, 5 to 10 hazards is a good starting point.
2. Identify Top event in Bow Tie Diagram
Once the hazard is chosen, the next step is to define the top event.
Top Event – is what can happen if barriers failed and control is lost, there is no damage or negative impact yet, but it is imminent.
This means that the top event is chosen just before events start causing actual damage. The top event is a choice though, what is the exact moment that control is lost? This is to a large extent a subjective and pragmatic choice. Often, the top event is reformulated after the rest of the bowtie is finished. Don’t worry too much at the beginning about formulation. You can start with a generic ‘loss of control’ and revisit it a couple of times during the bowtie process to sharpen the formulation.
3. Threats in Bow Tie Diagram
Threats – are whatever will cause your top event.
There can be multiple threats. Try to avoid generic formulations like ‘human error’, ‘equipment failure’ or ‘weather conditions. Try to answer these questions:
- What does a person actually do to cause the top event?
- Which piece of equipment?
- What kind of weather or what does the weather impact?
You can be too specific as well, but generally, people tend to be too generic.
4. Identify Consequences in Bow Tie Diagram
Consequence – result from the top event.
There can be more than one consequence for every top event. As with the threats, people tend to focus on generic categories instead of describing specific events.
Try not to focus on injury/ fatality, asset damage, environmental damage, reputation damage or financial damage. Those are broader categories of damage rather than specific consequence event descriptions. Try to describe events like:
- ‘car roll over’,
- ‘oil spill into the sea’ or
- ‘toxic cloud forms’.
Besides containing more specific information, you’re also helping yourself to think more specifically when coming up with barriers. Think about how you want to prevent ‘environmental damage’ versus ‘oil spill into the sea’. The latter is an actual scenario which makes it much easier to come up with specific barriers.
5. Identify Barriers in Bow Tie Diagram
At this stage, you have a clear understanding of the risk and what needs to be controlled. The hazard, top event, threats, and consequences give us an overview of everything we don’t want around a certain hazard. Every line through the bowtie represents a different potential incident. Besides containing incident scenarios that might already have occurred, part of the strength of the bowtie is that there is also room for scenarios which might have happened but luckily didn’t. This makes it a very proactive approach.
Now that we have the unwanted scenarios, it’s time to look at how to control these scenarios as an organization. This is done using ‘barriers’.
Barriers in the bowtie appear on both sides of the top event. Barriers interrupt the scenario so that the threats do not result in a loss of control (the top event) or do not escalate into an actual impact (the consequences).
There are different types of barriers, which are mainly a combination of human behavior and/or hardware/technology. Once the barriers are identified, you have a basic understanding of how risks are managed. You can build on this basic barrier structure further to deepen your understanding of where the weaknesses are.
Barriers can be extended beside barrier types to include for instance barrier effectiveness. This lets you assess how well a barrier performs. After that, you can look at the activities you have to implement and maintain your barriers. This essentially means mapping you Safety Management System (SMS) on the barriers. Also determining who is responsible for a barrier and assessing the criticality of a barrier are things you can do to increase your understanding of the barriers.
6. Identify Escalation factors barriers in Bow Tie Diagram
Barriers are never perfect. Even the best hardware barrier can fail. Given this fact, what you need to know is why a barrier can fail. This is done using the ‘escalation factor’.
Escalation Factor – anything that will make a barrier fail can be described in an escalation factor.
For instance, a door that opens and closes automatically using an electrical mechanism might fail if there’s a power failure.
Note: be careful with escalation factors. You do not describe all the potential failure modes. Only describe the real weaknesses of your control framework and how you want to manage that.
7. Identify Escalation factor barriers in Bow Tie Diagram
The logical next step to manage escalation factors is to create barriers for you escalation factors, apply named ‘escalation factor barriers’. In this case with a door that opens and closes automatically using an electrical mechanism, escalation barrier would be the backup generator.
Based on original article by cgerisk.com


